Provision in Bylaws: The Bylaws of the Company establish the distribution of a minimum dividend that is the higher of R$359 million or 25% of net income from the year (IFRS).
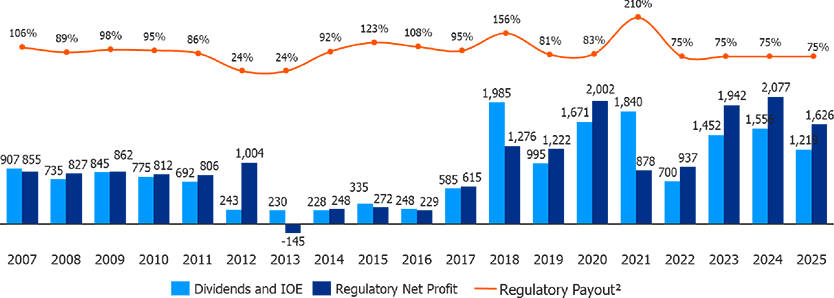
Dividend practice: ISA ENERGIA BRASIL’s dividend practice is to distribute at least 75% of regulatory net income (used as proxy for cash generation), subject to approval by the Shareholders Meeting, and the possibility of paying interim dividends, always ensuring that the dividend will be equal to or higher than minimum mandatory dividends.
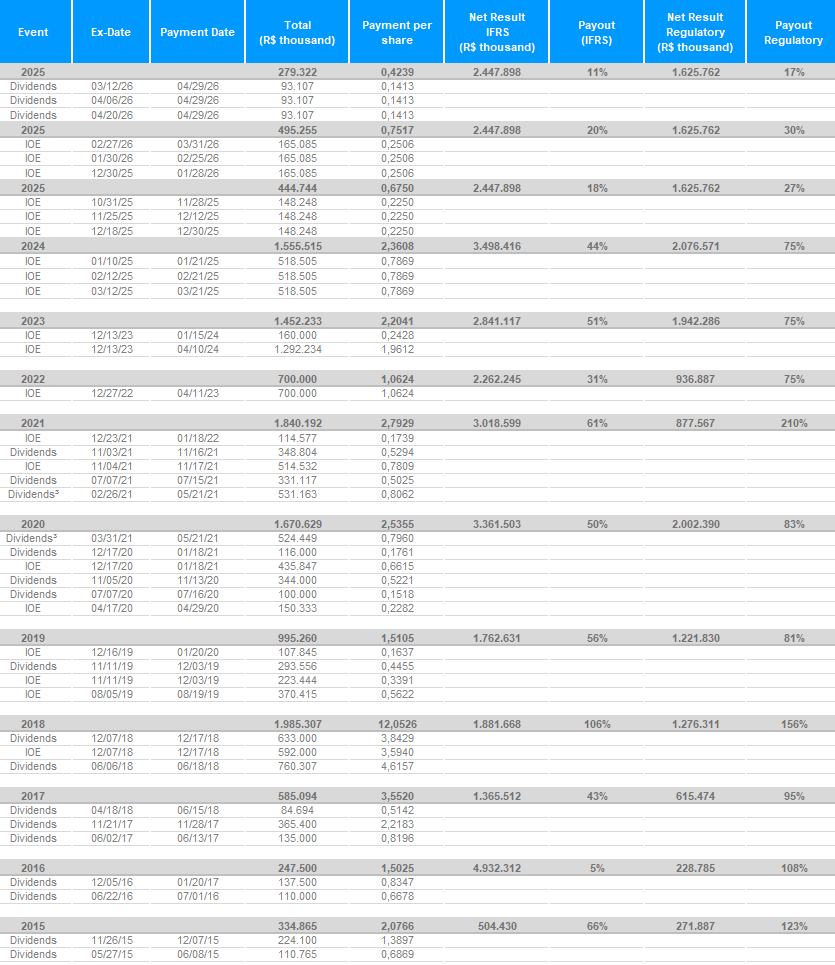
On February 24, 2026, the Board of Directors of ISA ENERGIA BRASIL approved the distribution of dividends in the total amount of R$ 279.3 million, corresponding to R$ 0.423933 per share of both classes of shares. The distribution of the dividend amount, net of withholding income tax, will be made in three payments, each with its respective record date, ex‑dividend date and payment date. Click here to access the full Notice to Shareholders.
| Earning Type | Deliberation Date | Distribution Base | Record Date | Ex-right Date | Payment Date | Total (R$ million) | Gross R$ / share |
|---|---|---|---|---|---|---|---|
| Dividends | 24-Feb-26 | Result of the fiscal year 2025 | 12-Mar-26 | 13-Mar-26 | 29-Apr-26 | 93.1 | 0.141311 |
| 2-Apr-26 | 6-Apr-26 | 29-Apr-26 | 93.1 | 0.141311 | |||
| 17-Apr-26 | 20-Apr-26 | 29-Apr-26 | 93.1 | 0.141311 | |||
| Total | 279.3 | 0.423933 | |||||
Historic of Earnings Distribution1 (R$ million)
Annual Summary of Earnings Distribution (R$ million)
| Payment Year | IOE (R$ thousand) |
Dividends (R$ thousand) |
Total (R$ thousand) |
Payment per share |
Dividends per share |
|---|---|---|---|---|---|
| 2026 | 495.255 | 279.322 | 774.577 | R$0,752 | R$0,42393 |
| 2025 | 2.000.259 | - | 2.000.259 | R$3,036 | R$- |
| 2024 | 1.452.233 | - | 1.452.233 | R$2,204 | R$- |
| 2023 | 700.000 | - | 700.000 | R$1,062 | R$- |
| 2022 | 114.577 | - | 114.577 | R$0,174 | R$- |
| 2021 | 950.379 | 1.851.532 | 2.801.911 | R$1,442 | R$2,81011 |
| 2020 | 258.178 | 444.000 | 702.178 | R$0,392 | R$0,67387 |
| 2019 | 593.859 | 293.556 | 887.415 | R$0,901 | R$0,44554 |
| 2018 | 592.000 | 1.478.000 | 2.070.000 | R$3,594 | R$8,97276 |
| 2017 | - | 637.900 | 637.900 | R$- | R$3,87261 |
| 2016 | - | 110.000 | 110.000 | R$- | R$0,66780 |
| 2015 | - | 365.894 | 365.894 | R$- | R$2,26898 |
| 2014 | 231.690 | 195.000 | 426.690 | R$1,507 | R$1,21971 |
| 2013 | - | - | - | R$- | R$- |
| 2012 | 128.108 | 348.573 | 476.681 | R$0,839 | R$2,28330 |
| 2011 | 253.409 | 643.391 | 896.800 | R$1,669 | R$4,23760 |
| 2010 | 188.566 | 578.234 | 766.800 | R$1,245 | R$3,82337 |
| 2009 | 250.610 | 392.677 | 643.288 | R$1,671 | R$2,62408 |
| 2008 | 279.021 | 436.612 | 715.633 | R$1,869 | R$2,92469 |
| 2007 | 226.792 | 559.357 | 786.149 | R$1,519 | R$3,74691 |
| 2006 | 90.000 | 97.300 | 187.300 | R$0,603 | R$0,65177 |
| 2005 | 224.354 | - | 224.354 | R$1,503 | R$- |
| 2004 | 147.249 | - | 147.249 | R$0,986 | R$- |
| 2003 | 50.000 | 12.782 | 62.782 | R$0,335 | R$0,08562 |
| 2002 | 86.353 | - | 86.353 | R$0,578 | R$- |
| Total | 9.312.893 | 8.724.131 | 18.037.024 | R$ 27,882 | R$ 41,7 |
|---|
| Fiscal Year (base) |
IOE (R$ thousand) |
Dividends (R$ thousand) |
Total (R$ thousand) |
Net Result Regulatory (R$ thousand) |
Payout Regulatory |
|---|---|---|---|---|---|
| 2026 | - | - | - | R$ - | N/A |
| 2025 | 939.999 | 279.322 | 1.219.322 | R$1.625.762 | 75% |
| 2024 | 1.555.515 | - | 1.555.515 | R$2.076.571 | 75% |
| 2023 | 1.452.233 | - | 1.452.233 | R$1.942.286 | 75% |
| 2022 | 700.000 | - | 700.000 | R$936.887 | 75% |
| 2021 | 629.109 | 1.211.083 | 1.840.192 | R$877.567 | 210% |
| 2020 | 586.180 | 1.084.449 | 1.670.629 | R$2.002.390 | 83% |
| 2019 | 701.705 | 293.556 | 995.260 | R$1.221.830 | 81% |
| 2018 | 592.000 | 1.393.307 | 1.985.307 | R$1.276.311 | 156% |
| 2017 | - | 585.094 | 585.094 | R$615.474 | 95% |
| 2016 | - | 247.500 | 247.500 | R$228.785 | 108% |
| 2015 | - | 334.865 | 334.865 | R$271.887 | 123% |
| 2014 | 31.690 | 196.029 | 227.719 | R$248.140 | 92% |
| 2013 | 200.000 | 30.000 | 230.000 | -R$ 145.400 | N/A |
| 2012 | 63.950 | 178.731 | 242.681 | R$1.004.000 | 24% |
| 2011 | 188.847 | 503.138 | 691.986 | R$805.700 | 86% |
| 2010 | 255.366 | 520.046 | 775.412 | R$812.171 | 95% |
| 2009 | 312.530 | 532.569 | 845.100 | R$861.975 | 98% |
| 2008 | 239.898 | 495.003 | 734.901 | R$827.065 | 89% |
| 2007 | 238.737 | 668.759 | 907.496 | R$855.483 | 106% |
| 2006 | 27.177 | 157.898 | 185.076 | R$117.752 | 157% |
| 2005 | 239.354 | - | 239.354 | R$468.277 | 51% |
| 2004 | 75.000 | - | 75.000 | R$348.778 | 22% |
| 2003 | 147.249 | - | 147.249 | R$222.376 | 66% |
| 2002 | 136.353 | 12.782 | 149.135 | R$168.137 | 89% |
| Total | 9.312.893 | 8.724.131 | 18.037.024 | R$19.670.203,9 | 92% |
|---|
Click here to download the spreadsheet
Annual Summary of Earnings Distribution (R$ million)
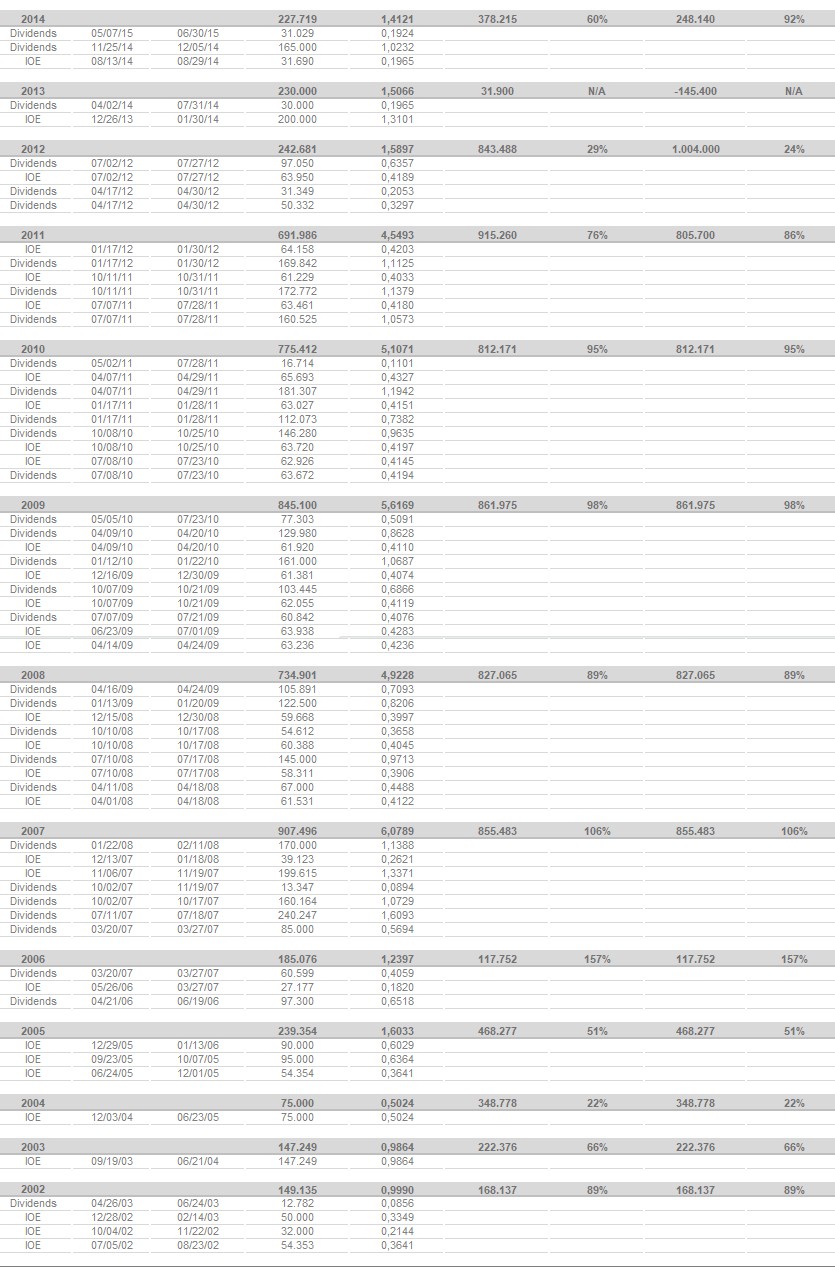
2 Distribution of dividends, based on the reserve constituted in the financial statements regarding the year of 2017.
3 Distribution of interim dividends on the constituted profit reserve.
Updated on March 26, 2026.